
Handset statistics are notoriously hard to come by - only the operators know what handsets are actually being used by all customers on their network, and they won't tell. Every other purveyor of statistics has an inherent bias, which makes them more attractive for some analyses and less for others. For example:
- GetJar make comprehensive statistics available for who is downloading applications from their site and have huge cross-operator volumes of downloads
- ...but many of these are downloaded via the web and synced through a cable, a highly unusual activity for most mobile users
- ...which puts a huge skew on the data - I'm pretty certain Amoi aren't actually larger in the UK market than RIM's Blackberry.
- Bango publish a Top 20 handsets list every month or so, with a skew for their operator relationships
- Top 20 is great but there are plenty of handsets below that which are still worth supporting
- AdMob have some immensely detailed metrics reports, but again the operator partner skew was always very visible
- I'm just not convinced that anything by ZTE is actually in the Top 10 most popular UK phones!
- I'm also unconvinced that the iPod Touch is much more popular than the iPhone...
User Profiles
All of these statistics have great value, but none of these companies can actually give an overall picture fo the entire market. Each set will be skewed heavily based on the type of user attracted to the service and the operator relationships that service has. To find out the overall market picture fudge them all together and treat with care - but by profiling each site you can find out more useful information for specific needs.
AdMob, as the main provider of mobile web advertising, offer a very good view of the mobile data user, who would also be an obvious early adopter of any mobile service requiring net access, be it web-based or a networked application.
Traditionally, AdMob have just given a Top N list of device models and some aggregate manufacturer numbers, which were never enough to tell anything useful - their strong relationship with MVNO Three clearly led to some very obvious weird "popular" handsets showing up and called all of the data into question.
I had always dismissed them at this point and moved on. Fortunately, though, when you look inside the reports they publish per-operator statistics for each manufacturer - so we can actually derive some meaningful national conclusions!
Hacking The Stats
So - why hack? Don't we have everything we need?
Sadly not - the July '09 report is a very nice professional PDF given graphical summaries of the manufacturer breakdown per-operator, as a series of proportions in stacked columns:
Whilst it is flattering, as a Jersey boy, to see Jersey Telecoms given equal weight to Vodafone, I have a sneaking suspicion that the entire population of Jersey is equivalent to a rounding error when counting Vodafone's UK customer base.
What we need is to convert these into national numbers, by weighting all of the proportions by the size of the operator. The only way to do this with the public information is to screenshot the graph from the PDF at the largest size you can get it, and count the pixels for every bar - tedious, but luckily for you I've done it for you.
Telecoms Market Research provide some useful figures from Q1 2008 for each operator (not up to date, but close enough for these purposes):
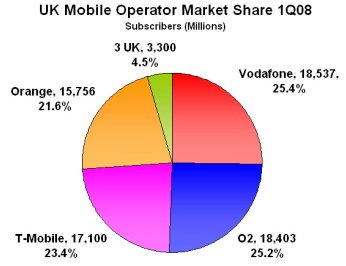
Once we aggregate all of these weighted proportions, we end up with the following rough proportions for manufacturers among early mobile web adopters:

It won't help everyone, but hopefully it is of some use for anyone struggling for some statistics!